Monitoring Tutorial -- Preliminary Version
This tutorial will guide you through the definition of Monitoring example and to upload it.
Note
This tutorial assumes that you use a Unix system.
Create all the folders needded
$ mkdir monitoring-softfire
$ cd monitoring-softfire
$ mkdir TOSCA-Metadata
$ mkdir Definitions
Then you need to create the necessary files.
touch TOSCA-Metadata/TOSCA.meta
touch TOSCA-Metadata/Metadata.yaml
touch Definitions/experiment.yaml
The TOSCA-Metadata/TOSCA.meta file contains TOSCA specific configurations:
vim TOSCA-Metadata/TOSCA.meta
Here you must write something like the following example:
TOSCA-Meta-File-Version: 1.0
CSAR-Version: 1.1
Created-By: SoftFIRE
Entry-Definitions: Definitions/experiment.yaml
If you wish, you can change the Created-By property.
Then you do the same with TOSCA-Metadata/Metadata.yaml, that contains Metadata info of the experiment.
vim TOSCA-Metadata/Metadata.yaml
Here you should write something like the following example:
name: Experiment Name
start-date: "2017-08-10"
end-date: "2017-08-11"
Change start-date and end-date fields according to your experiment. Now you can write the definition of the experiment:
vim Definitions/experiment.yaml
Here you should write something like the following example:
description: "Template for SoftFIRE yaml resource request definition"
imports:
  - softfire_node_types: "http://docs.softfire.eu/etc/softfire_node_types.yaml"
topology_template:
  node_templates:
    m:
      type: MonitoringResource
      properties:
        testbed: ericsson
        lan_name: Zabbix_Lan
        resource_id: monitor
All fields are explained in the Monitoring manager page
Create the CSAR file as following:
zip -r monitoring.csar . -x ".*" -x "*/.*"
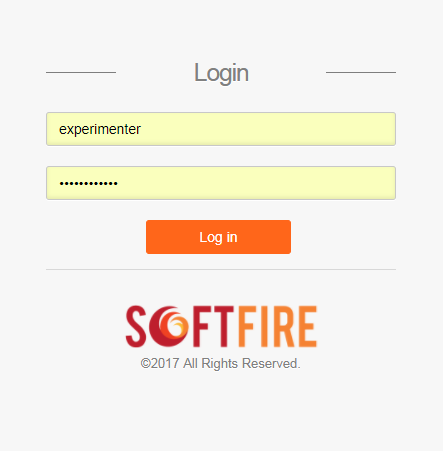
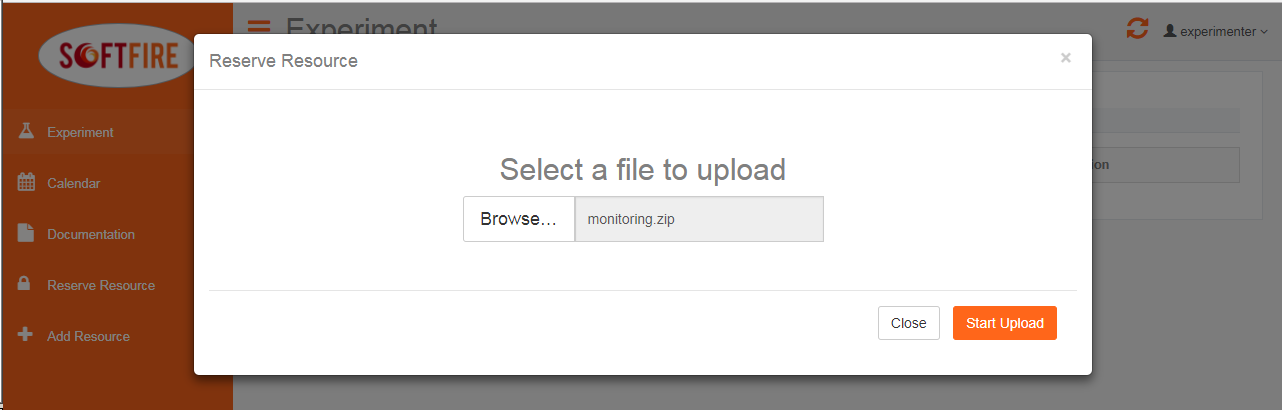
Now you have to upload the zip file to the Experiment Manager via GUI, as shown in the following screenshots. Go to experimenter page and login with your registered credentials, then click on "Reserve Resource"

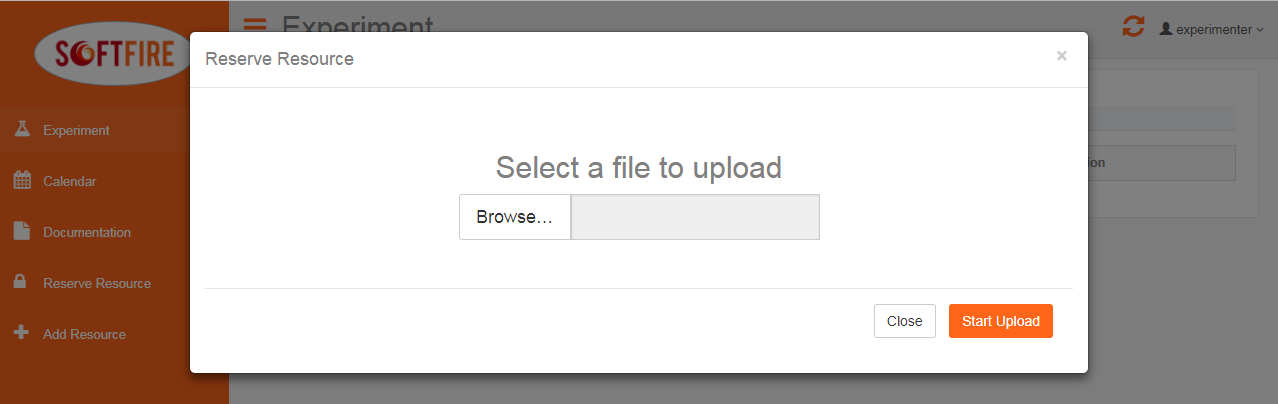
Now you can select the zip file to upload and then click on Start Upload.
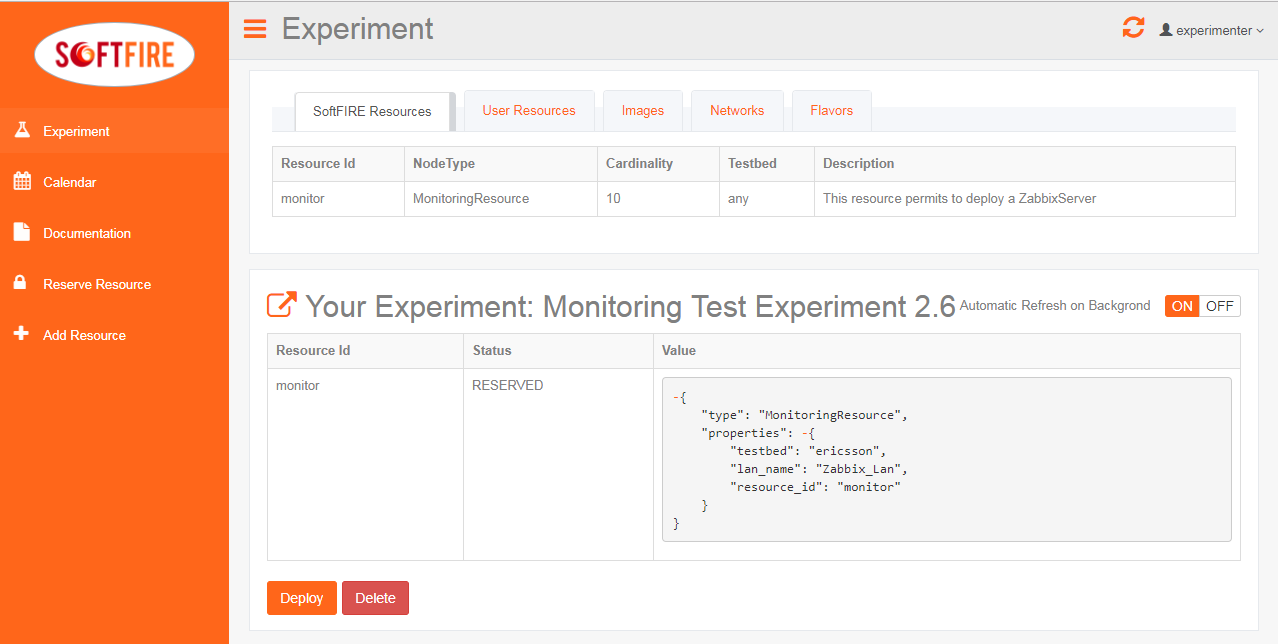
The Managers will validate the resources, in case you did some mistake they should be shown now. If no errors are shown, you are able to deploy your resources by clicking deploy. Please consider that it takes some seconds to deploy the resource dependening in the experiment definition.
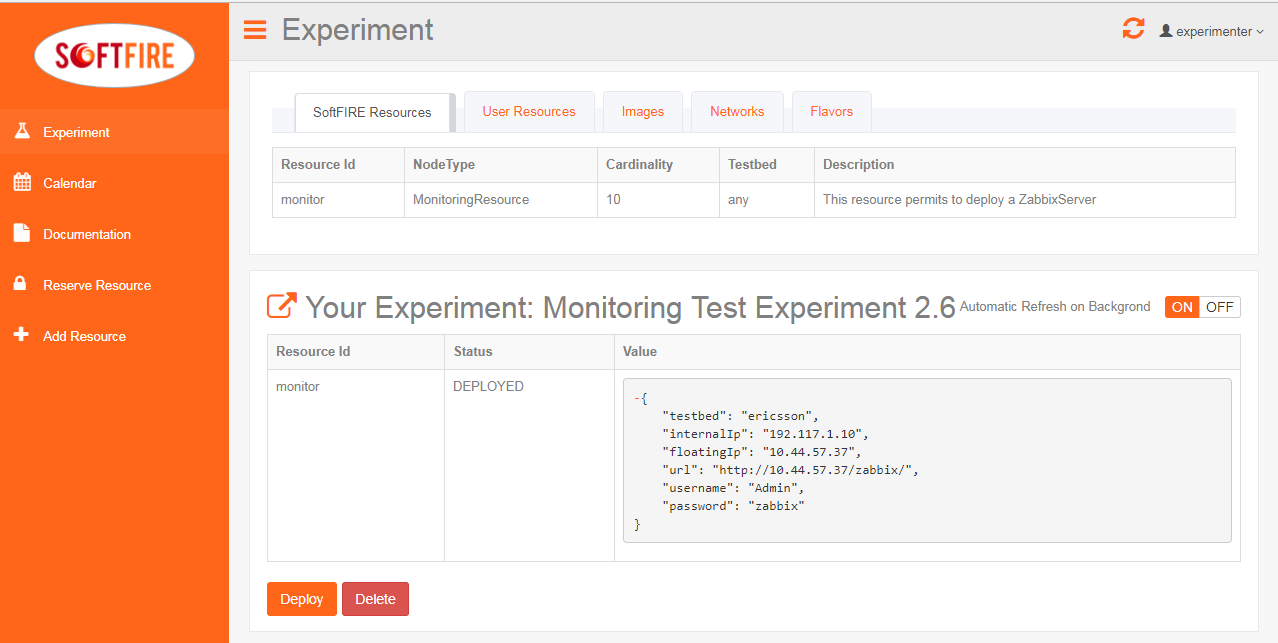
Once deployed, it will take time until reaching the ACTIVE state of the resource. Finally the monitoring resource reaches the ACTIVE state and also the floating ip are shown in the newly created resource section of the experimenter GUI. Note that the floating ip changes for every deployment.
Now you can access your Zabbix Server opening the URL shown in the picture above (http://10.44.57.37/zabbix/index.php)

You can access the Zabbix Server using the following credentials:
Username: Admin
Password: zabbix
On succesfull login the Zabbix Dashboard is displayed.
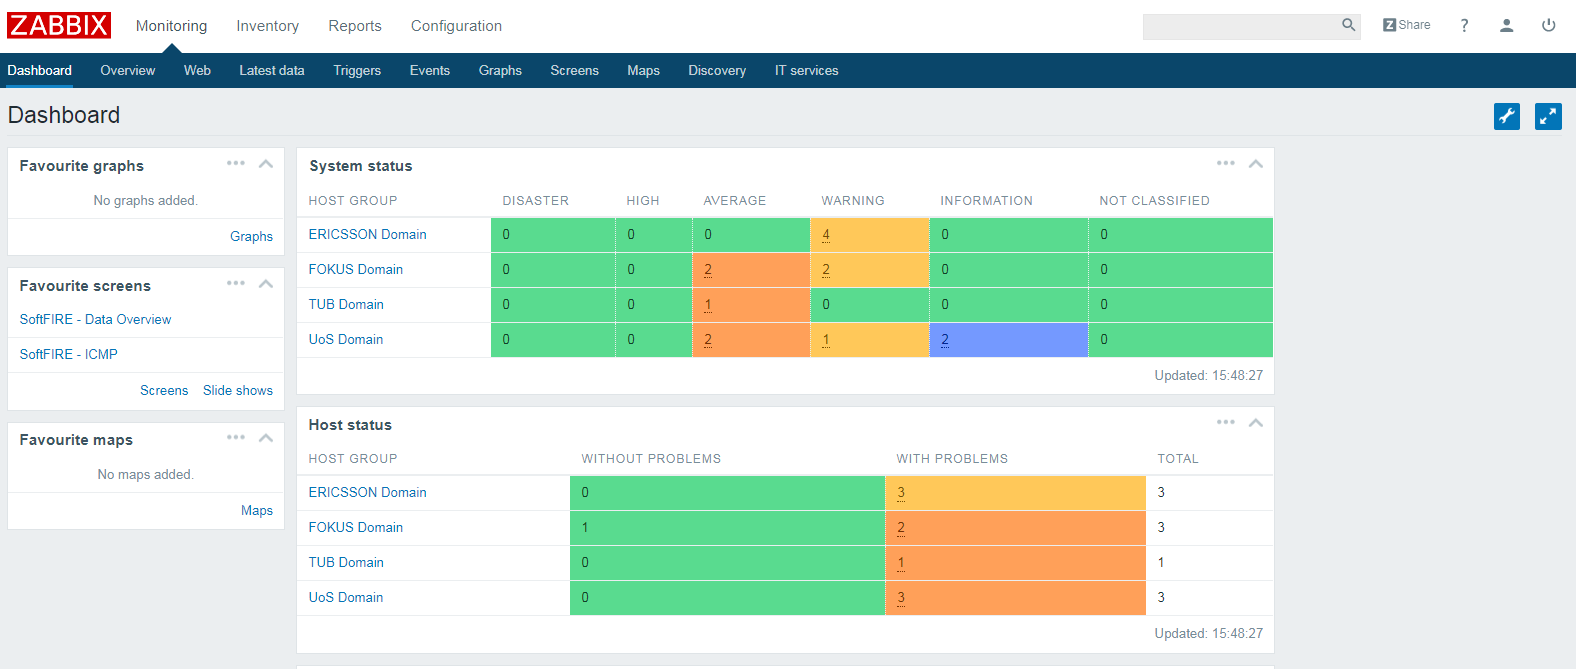
If you wish, you can tailor the Dashboard according to you monitoring needs.